Metros where homes are selling for the most over asking price
Metros where homes are selling for the most over asking price
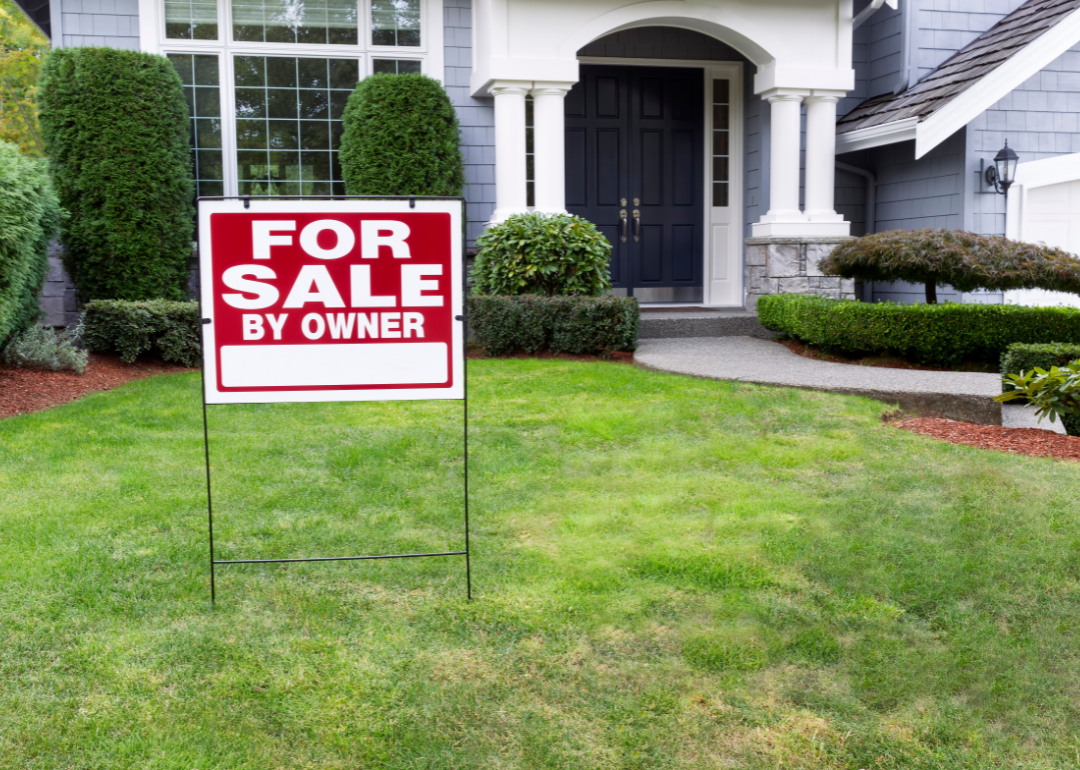
It's a tough time to be in the market for a new house. As peak homebuying season is underway, homebuyers are competing for a smaller number of homes, sending prices higher.
The median sale price in May was $439,716, a new record and 5.1% higher than the year before. Of homes that sold, 35% went for above the list price, and the average price difference was -0.1% below asking.
The average 30-year fixed-rate mortgage rose above 7% at the start of November 2022, the highest level in more than a decade, as the Federal Reserve raised its benchmark rates to combat inflation. Rates remain at historic highs. Even a half of a percentage point change can significantly affect the monthly payments required for a mortgage.
Since mortgage rates were under 4% for the better part of the past decade, many homebuyers locked in far more affordable rates than what's on offer in today's environment. However, there are some places where buyers are starting to have the upper hand, especially in markets that have recorded considerable price growth over the last few years.
Stacker analyzed data from Redfin to see which where homes sold for the most over the asking price. Metros, which include the main city and its surrounding town and suburbs, are ranked on the average sale-to-list ratio, which is the difference between what a home is listed for and how much a buyer paid. Metros with fewer than 300 home sales are excluded from this list. Also shown are the metro area's median listing prices for homes on the market and median sale prices for homes that sold during that month.
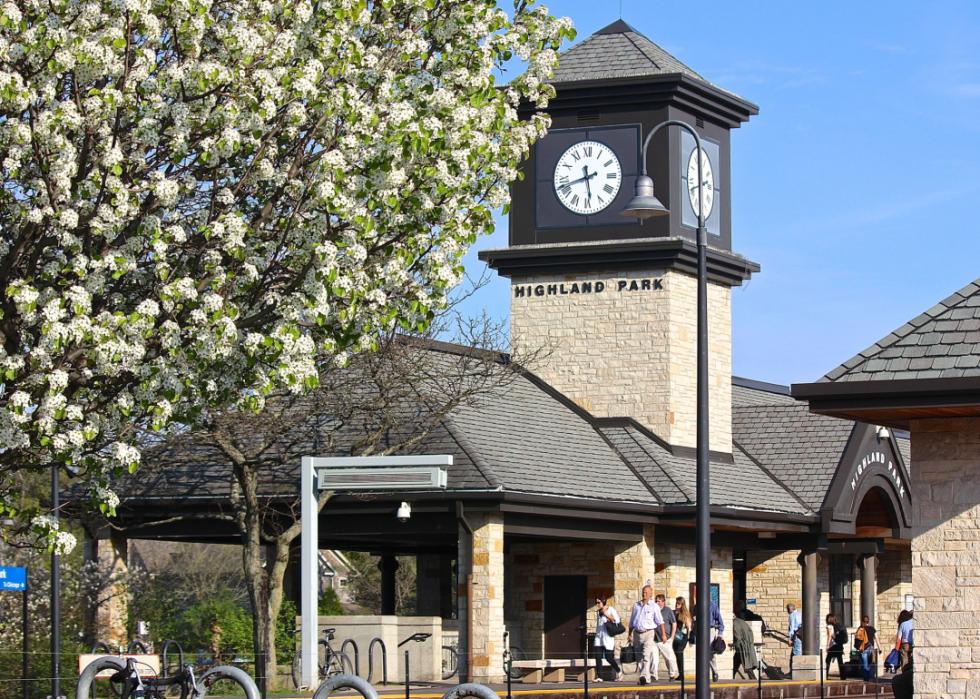
#50. Lake County, Illinois
- Average price difference: 0.76% over asking
-- Median list price: $375,000
-- Median sale price: $358,811
- Total homes sold: 980
-- Share that sold above list: 52.2%

#49. Tacoma, Washington
- Average price difference: 0.77% over asking
-- Median list price: $591,250
-- Median sale price: $560,000
- Total homes sold: 1,011
-- Share that sold above list: 44.1%
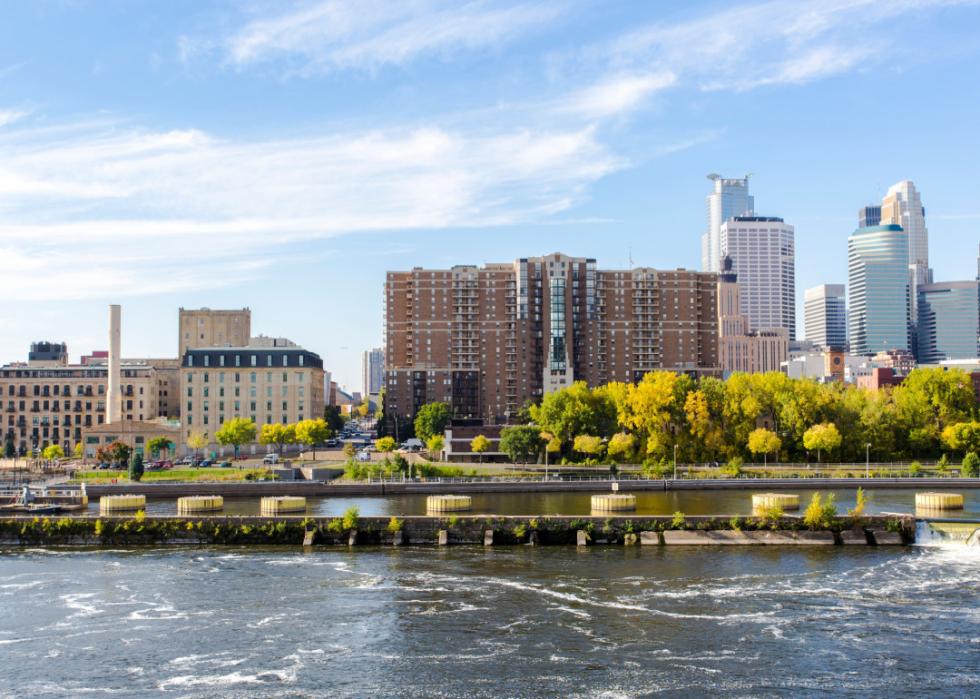
#48. Minneapolis, Minnesota
- Average price difference: 0.78% over asking
-- Median list price: $399,999
-- Median sale price: $386,657
- Total homes sold: 4,642
-- Share that sold above list: 44.3%

#47. Columbus, Ohio
- Average price difference: 0.82% over asking
-- Median list price: $350,000
-- Median sale price: $347,000
- Total homes sold: 2,642
-- Share that sold above list: 45.3%
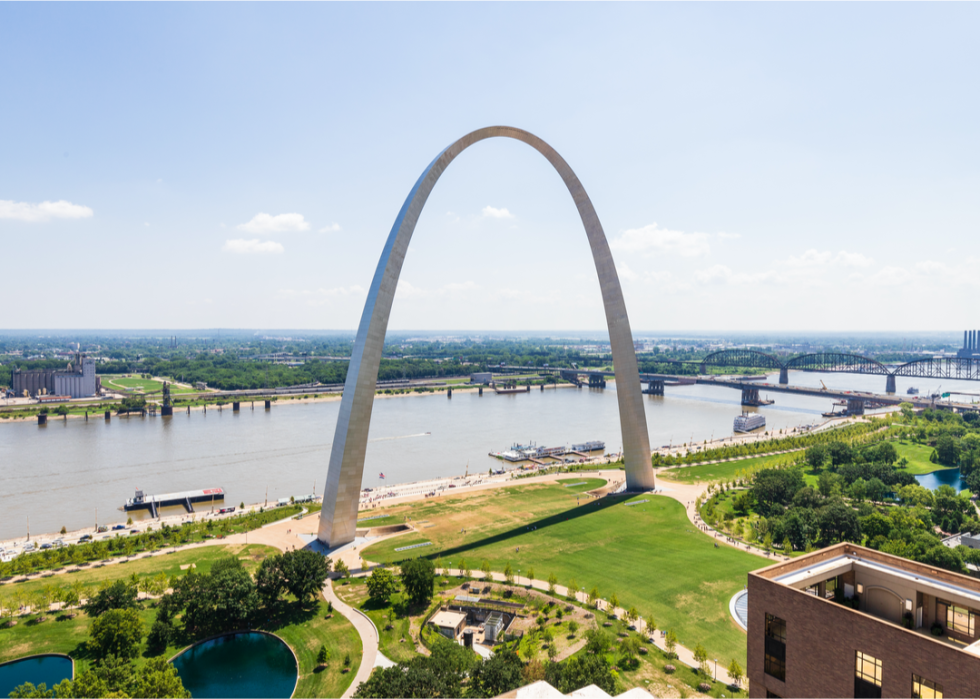
#46. St. Louis, Missouri
- Average price difference: 0.95% over asking
-- Median list price: $279,000
-- Median sale price: $268,000
- Total homes sold: 3,423
-- Share that sold above list: 47.8%

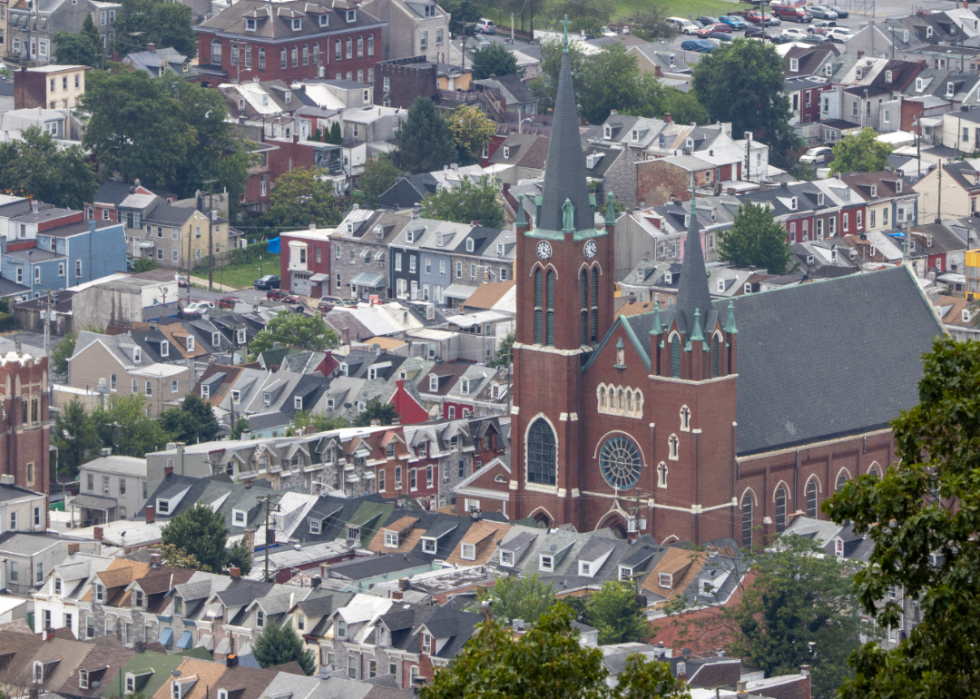
#45. Harrisburg, Pennsylvania
- Average price difference: 1.04% over asking
-- Median list price: $290,000
-- Median sale price: $280,000
- Total homes sold: 627
-- Share that sold above list: 46.3%

#44. Baltimore, Maryland
- Average price difference: 1.07% over asking
-- Median list price: $399,900
-- Median sale price: $399,000
- Total homes sold: 3,258
-- Share that sold above list: 49.5%
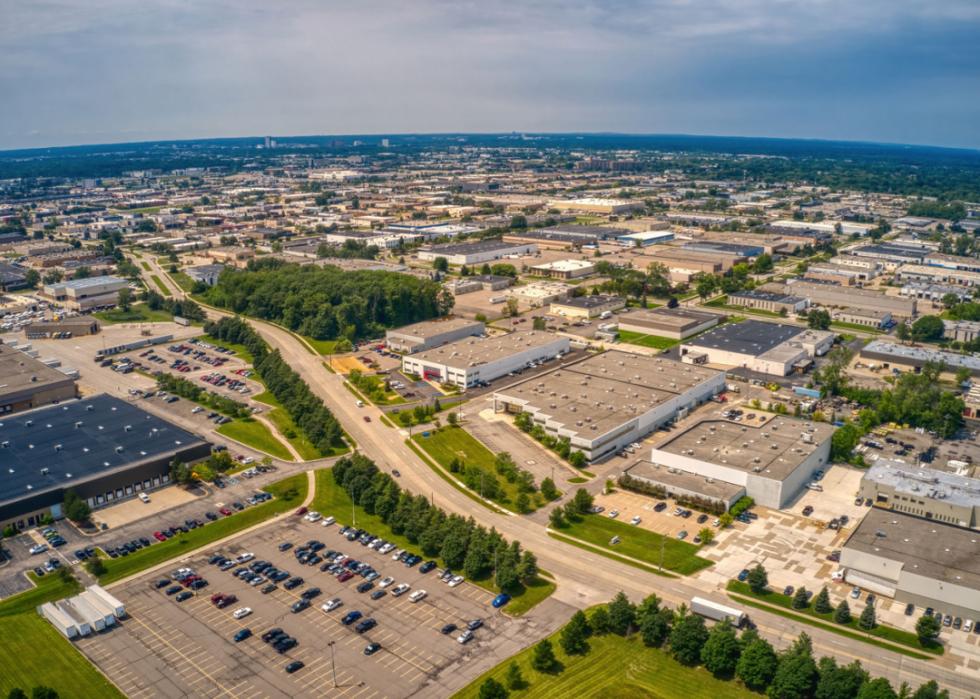
#43. Warren, Michigan
- Average price difference: 1.08% over asking
-- Median list price: $334,900
-- Median sale price: $315,750
- Total homes sold: 2,871
-- Share that sold above list: 51.7%
#42. Reading, Pennsylvania
- Average price difference: 1.12% over asking
-- Median list price: $289,900
-- Median sale price: $280,000
- Total homes sold: 414
-- Share that sold above list: 46.9%
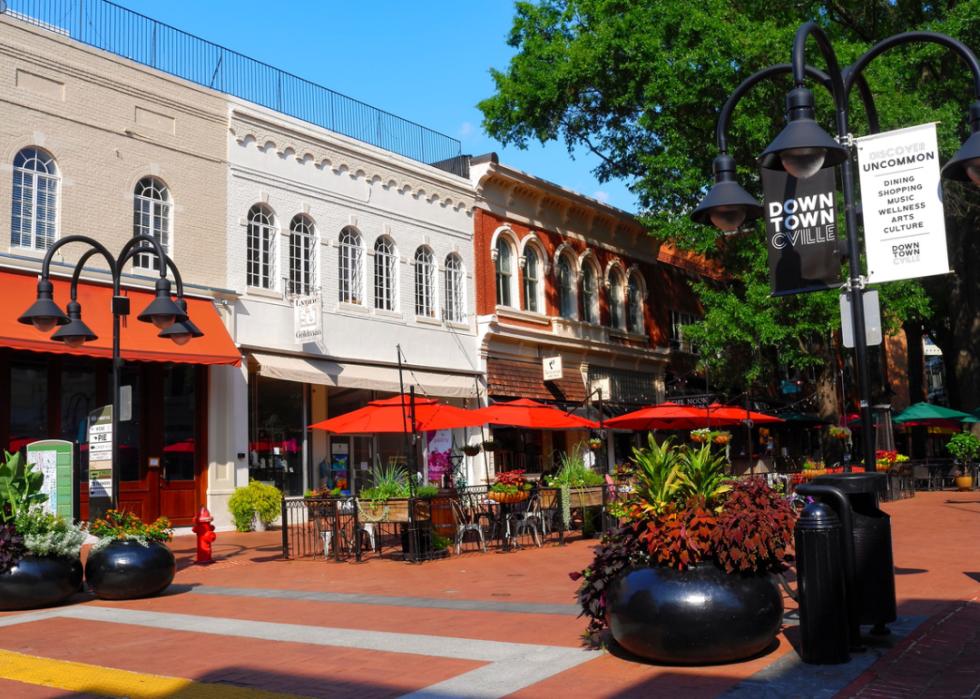
#41. Charlottesville, Virginia
- Average price difference: 1.18% over asking
-- Median list price: $506,427
-- Median sale price: $480,000
- Total homes sold: 317
-- Share that sold above list: 45.1%

#40. Nassau County, New York
- Average price difference: 1.21% over asking
-- Median list price: $724,444
-- Median sale price: $685,000
- Total homes sold: 1,812
-- Share that sold above list: 53.1%
#39. Rockford, Illinois
- Average price difference: 1.28% over asking
-- Median list price: $190,000
-- Median sale price: $186,500
- Total homes sold: 343
-- Share that sold above list: 51%

#38. Los Angeles, California
- Average price difference: 1.3% over asking
-- Median list price: $979,994
-- Median sale price: $908,000
- Total homes sold: 4,754
-- Share that sold above list: 52%

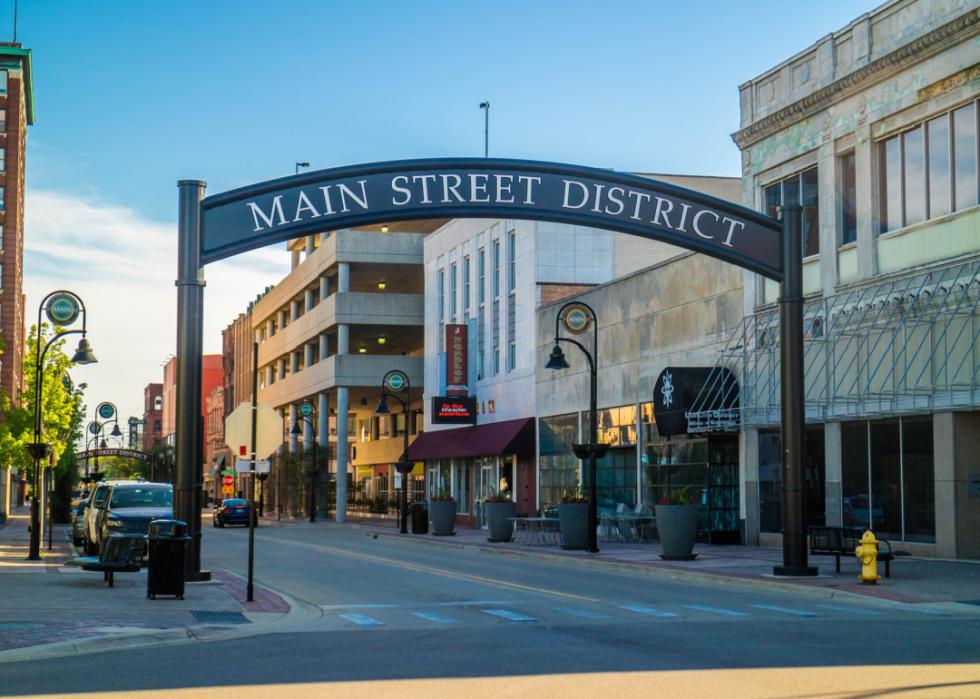
#37. Lansing, Michigan
- Average price difference: 1.35% over asking
-- Median list price: $230,000
-- Median sale price: $230,000
- Total homes sold: 608
-- Share that sold above list: 50.3%

#36. Santa Rosa, California
- Average price difference: 1.41% over asking
-- Median list price: $816,000
-- Median sale price: $825,500
- Total homes sold: 392
-- Share that sold above list: 49.7%
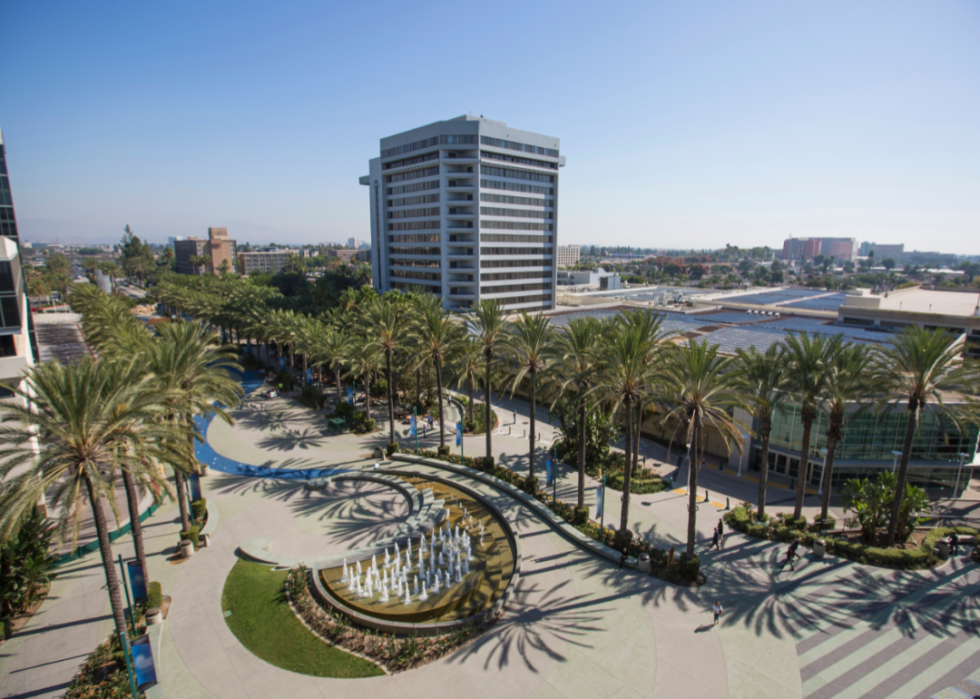
#35. Anaheim, California
- Average price difference: 1.54% over asking
-- Median list price: $1,200,000
-- Median sale price: $1,205,000
- Total homes sold: 2,161
-- Share that sold above list: 52.9%

#34. Washington DC
- Average price difference: 1.6% over asking
-- Median list price: $590,000
-- Median sale price: $590,000
- Total homes sold: 5,532
-- Share that sold above list: 52.5%

#33. Elgin, Illinois
- Average price difference: 1.6% over asking
-- Median list price: $370,000
-- Median sale price: $362,527
- Total homes sold: 872
-- Share that sold above list: 53.8%
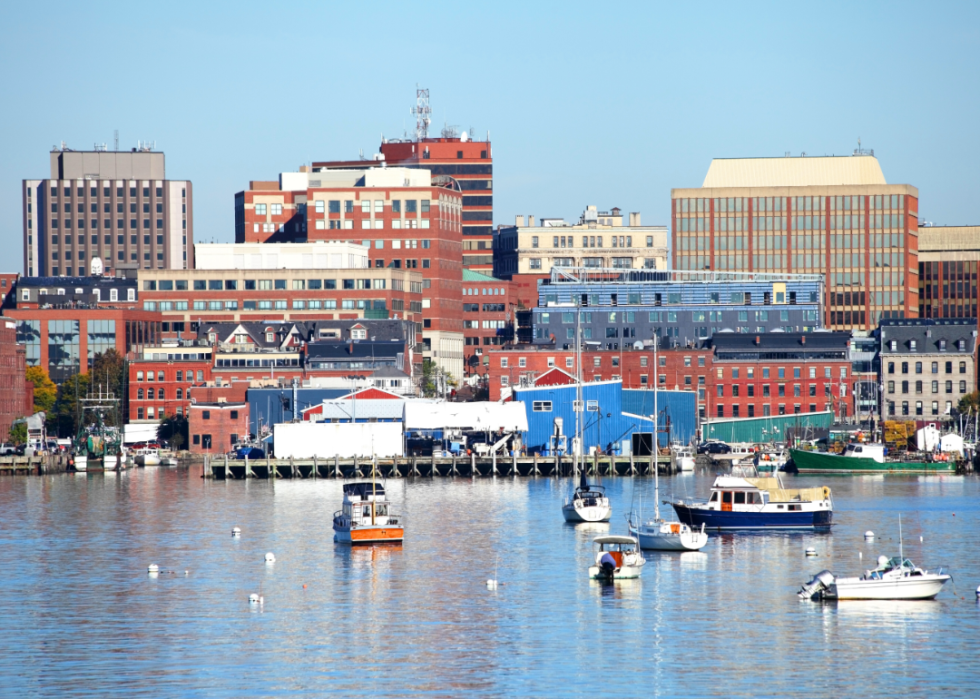
#32. Portland, Maine
- Average price difference: 1.63% over asking
-- Median list price: $550,000
-- Median sale price: $519,900
- Total homes sold: 639
-- Share that sold above list: 49.6%
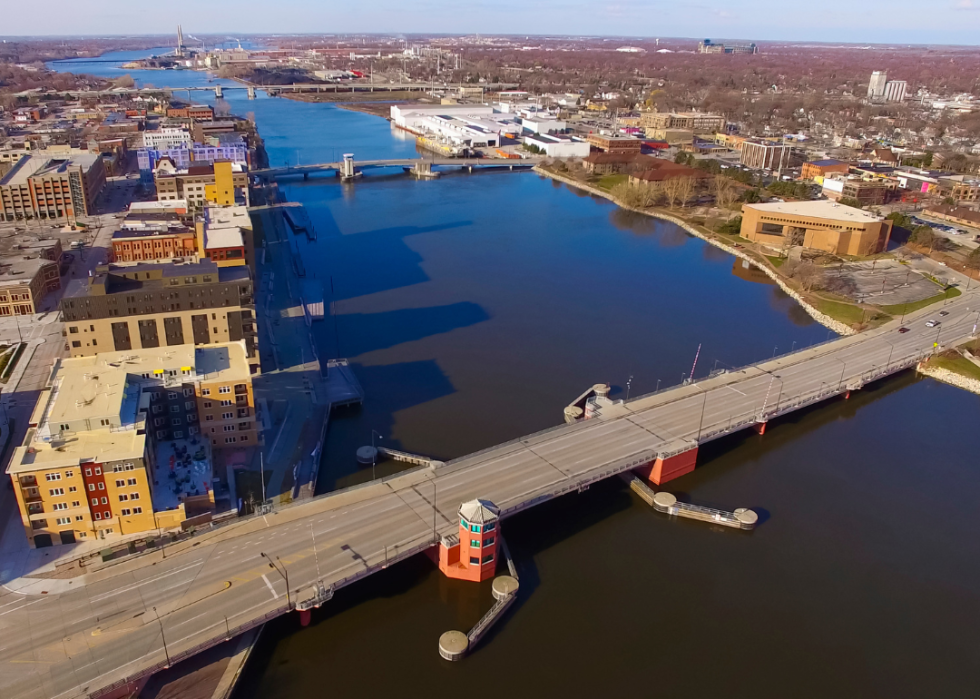
#31. Green Bay, Wisconsin
- Average price difference: 1.72% over asking
-- Median list price: $349,900
-- Median sale price: $305,500
- Total homes sold: 330
-- Share that sold above list: 55.8%

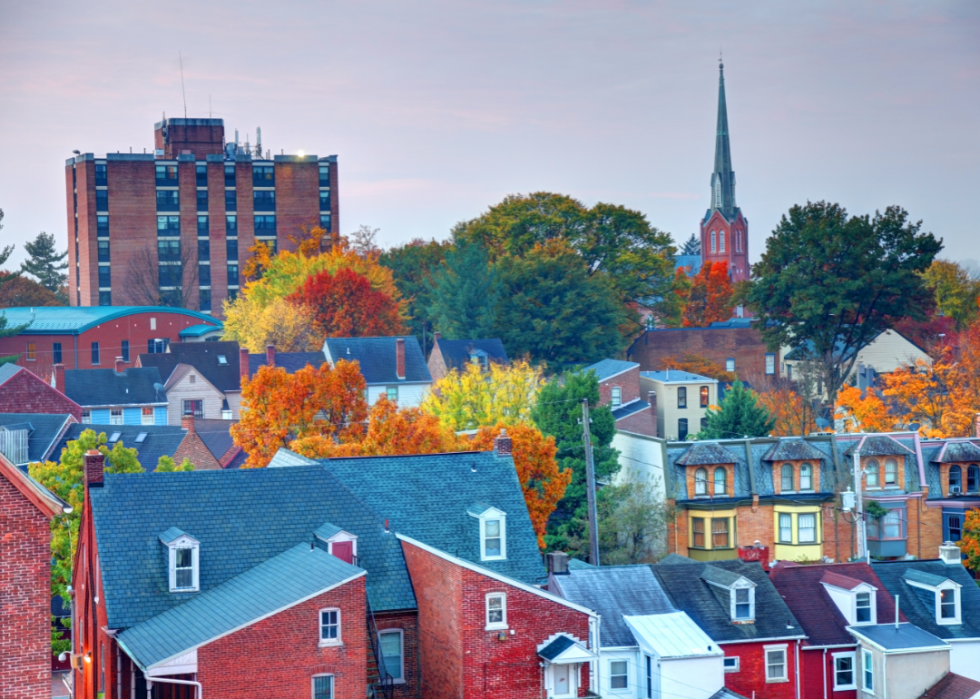
#30. Allentown, Pennsylvania
- Average price difference: 1.72% over asking
-- Median list price: $347,500
-- Median sale price: $330,000
- Total homes sold: 812
-- Share that sold above list: 53.8%

#29. Richmond, Virginia
- Average price difference: 1.92% over asking
-- Median list price: $412,000
-- Median sale price: $400,000
- Total homes sold: 1,716
-- Share that sold above list: 51.9%

#28. Rockingham County, New Hampshire
- Average price difference: 2.01% over asking
-- Median list price: $600,000
-- Median sale price: $575,000
- Total homes sold: 513
-- Share that sold above list: 58.3%
#27. Lancaster, Pennsylvania
- Average price difference: 2.03% over asking
-- Median list price: $334,590
-- Median sale price: $326,000
- Total homes sold: 387
-- Share that sold above list: 42.9%

#26. Grand Rapids, Michigan
- Average price difference: 2.27% over asking
-- Median list price: $349,900
-- Median sale price: $340,000
- Total homes sold: 1,146
-- Share that sold above list: 51.7%

#25. Seattle, Washington
- Average price difference: 2.31% over asking
-- Median list price: $869,000
-- Median sale price: $860,000
- Total homes sold: 3,526
-- Share that sold above list: 47.8%

#24. Montgomery County, Pennsylvania
- Average price difference: 2.35% over asking
-- Median list price: $510,000
-- Median sale price: $485,000
- Total homes sold: 1,844
-- Share that sold above list: 56.1%
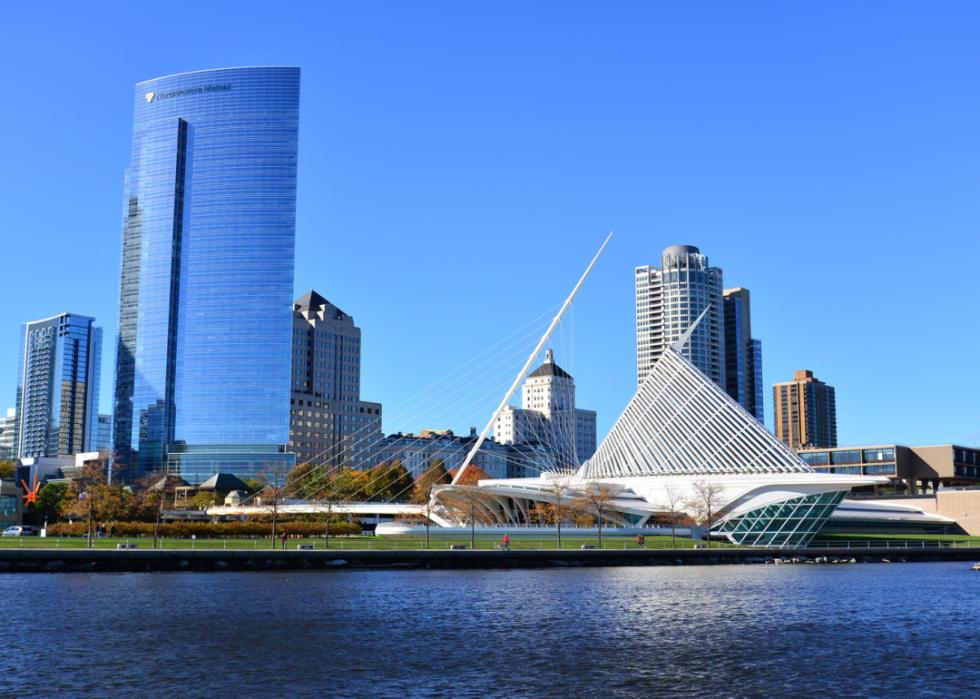
#23. Milwaukee, Wisconsin
- Average price difference: 2.35% over asking
-- Median list price: $350,000
-- Median sale price: $337,000
- Total homes sold: 1,715
-- Share that sold above list: 57.9%
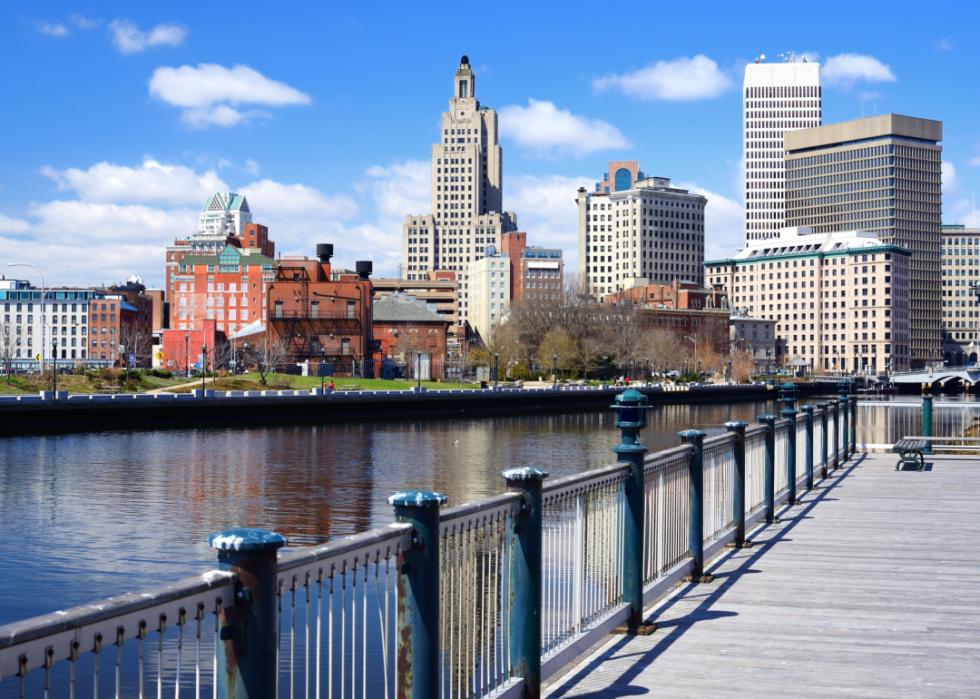
#22. Providence, Rhode Island
- Average price difference: 2.36% over asking
-- Median list price: $519,000
-- Median sale price: $475,000
- Total homes sold: 1,316
-- Share that sold above list: 60.6%

#21. New Brunswick, New Jersey
- Average price difference: 2.5% over asking
-- Median list price: $575,000
-- Median sale price: $535,000
- Total homes sold: 2,420
-- Share that sold above list: 56.1%

#20. Albany, New York
- Average price difference: 2.53% over asking
-- Median list price: $335,000
-- Median sale price: $325,000
- Total homes sold: 739
-- Share that sold above list: 58.3%
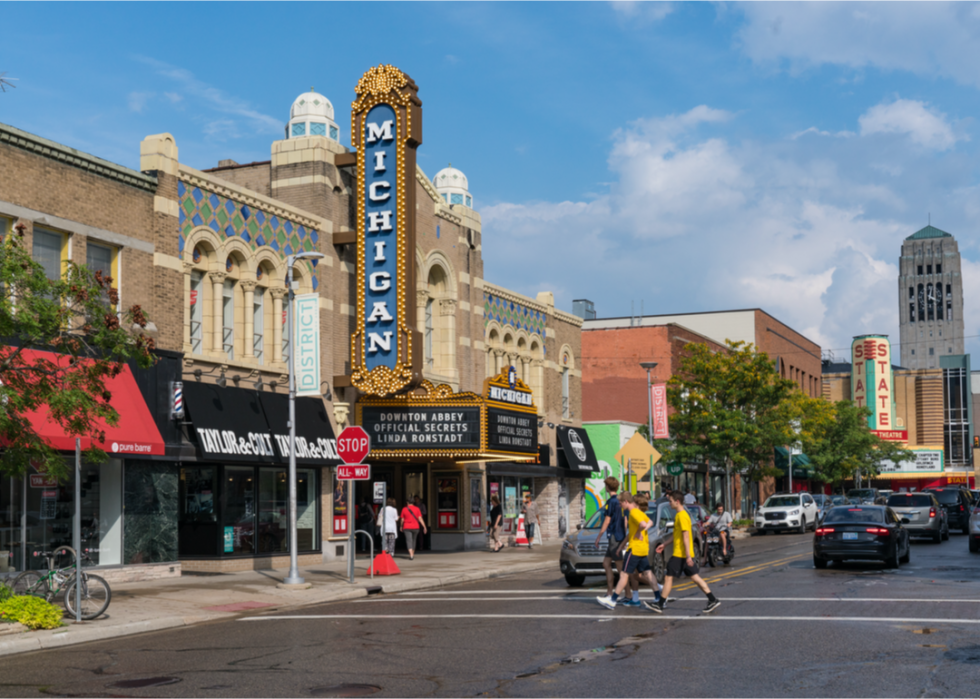
#19. Ann Arbor, Michigan
- Average price difference: 2.57% over asking
-- Median list price: $437,450
-- Median sale price: $430,000
- Total homes sold: 381
-- Share that sold above list: 55.1%
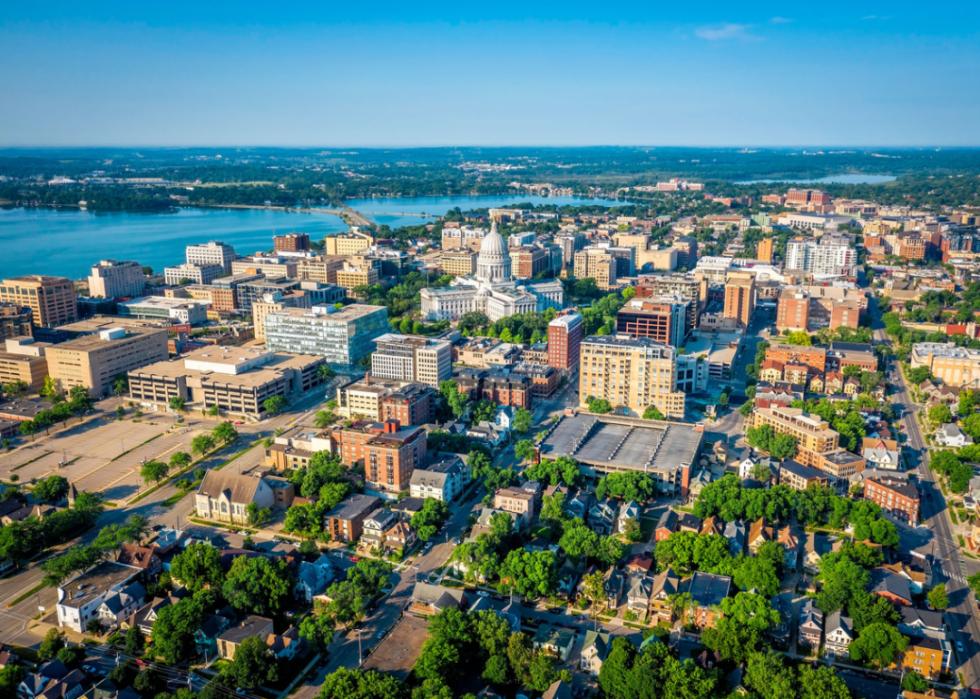
#18. Madison, Wisconsin
- Average price difference: 2.59% over asking
-- Median list price: $429,900
-- Median sale price: $424,200
- Total homes sold: 789
-- Share that sold above list: 53.6%
#17. Camden, New Jersey
- Average price difference: 2.66% over asking
-- Median list price: $364,450
-- Median sale price: $350,000
- Total homes sold: 1,248
-- Share that sold above list: 62.8%

#16. Frederick, Maryland
- Average price difference: 2.82% over asking
-- Median list price: $599,000
-- Median sale price: $615,000
- Total homes sold: 1,368
-- Share that sold above list: 57.7%

#15. Worcester, Massachusetts
- Average price difference: 2.82% over asking
-- Median list price: $479,949
-- Median sale price: $447,000
- Total homes sold: 847
-- Share that sold above list: 64.7%

#14. New Haven, Connecticut
- Average price difference: 3.12% over asking
-- Median list price: $374,900
-- Median sale price: $355,000
- Total homes sold: 724
-- Share that sold above list: 64.5%

#13. Boston, Massachusetts
- Average price difference: 3.38% over asking
-- Median list price: $775,000
-- Median sale price: $735,000
- Total homes sold: 3,574
-- Share that sold above list: 63.3%

#12. Springfield, Massachusetts
- Average price difference: 3.39% over asking
-- Median list price: $349,900
-- Median sale price: $345,000
- Total homes sold: 509
-- Share that sold above list: 67.6%

#11. Bridgeport, Connecticut
- Average price difference: 3.55% over asking
-- Median list price: $737,450
-- Median sale price: $623,500
- Total homes sold: 816
-- Share that sold above list: 60.8%

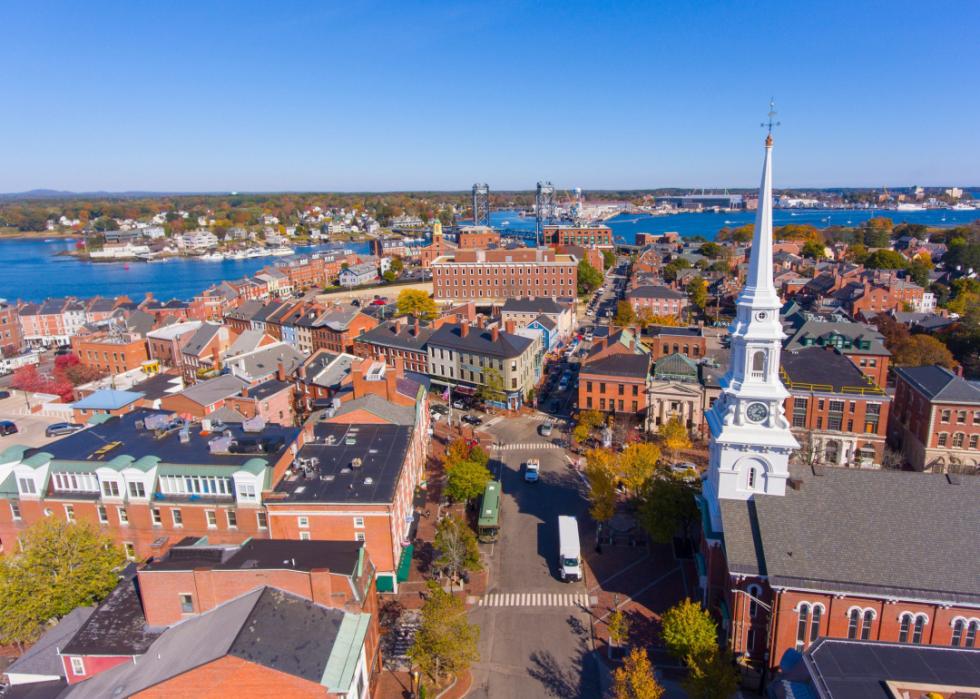
#10. Manchester, New Hampshire
- Average price difference: 3.91% over asking
-- Median list price: $522,400
-- Median sale price: $511,750
- Total homes sold: 390
-- Share that sold above list: 72.3%

#9. Trenton, New Jersey
- Average price difference: 4.33% over asking
-- Median list price: $427,000
-- Median sale price: $425,000
- Total homes sold: 302
-- Share that sold above list: 67.2%

#8. Syracuse, New York
- Average price difference: 4.8% over asking
-- Median list price: $239,900
-- Median sale price: $225,000
- Total homes sold: 462
-- Share that sold above list: 60.8%

#7. Hartford, Connecticut
- Average price difference: 5.29% over asking
-- Median list price: $379,900
-- Median sale price: $355,000
- Total homes sold: 995
-- Share that sold above list: 71.4%

#6. Oakland, California
- Average price difference: 5.46% over asking
-- Median list price: $958,000
-- Median sale price: $1,053,500
- Total homes sold: 2,098
-- Share that sold above list: 68.4%

#5. Newark, New Jersey
- Average price difference: 5.92% over asking
-- Median list price: $599,900
-- Median sale price: $600,000
- Total homes sold: 1,740
-- Share that sold above list: 68.2%
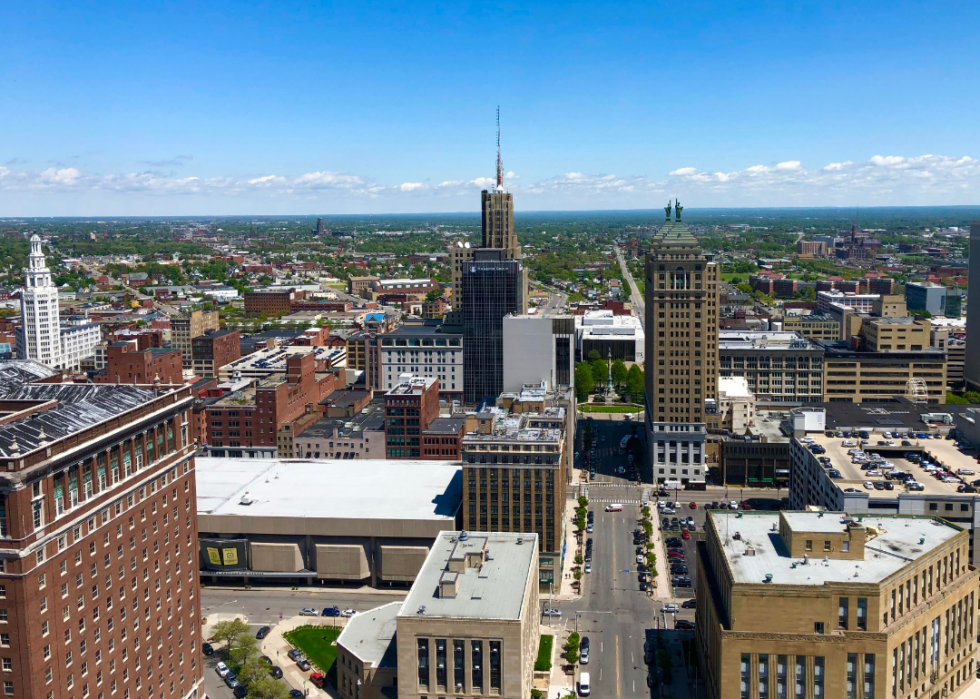
#4. Buffalo, New York
- Average price difference: 6.32% over asking
-- Median list price: $249,999
-- Median sale price: $250,000
- Total homes sold: 720
-- Share that sold above list: 65.3%

#3. San Francisco, California
- Average price difference: 6.34% over asking
-- Median list price: $1,465,000
-- Median sale price: $1,557,500
- Total homes sold: 996
-- Share that sold above list: 64.5%
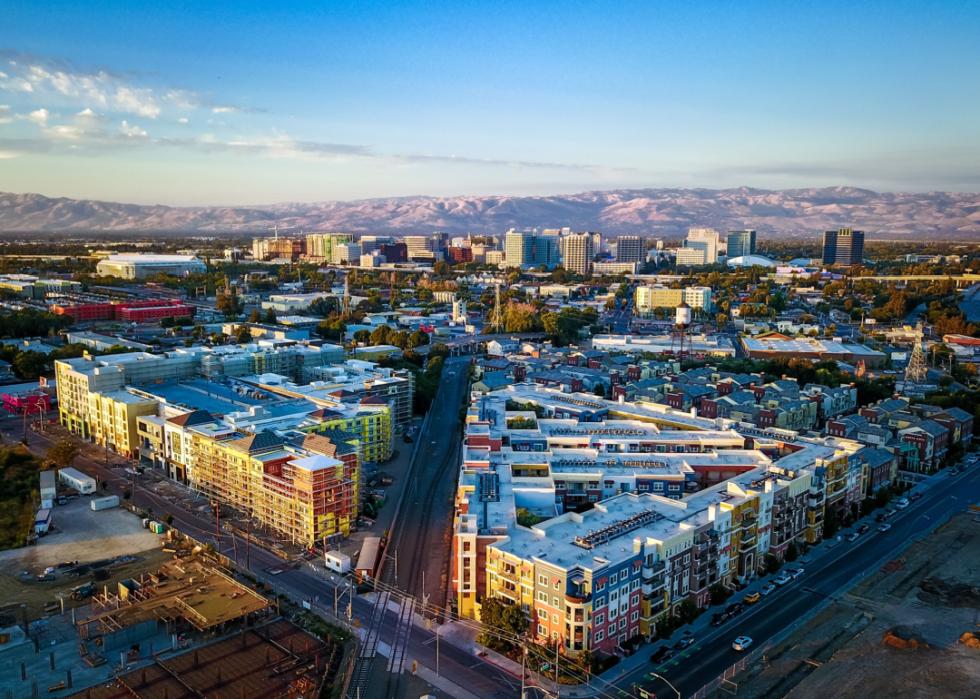
#2. San Jose, California
- Average price difference: 7.21% over asking
-- Median list price: $1,499,000
-- Median sale price: $1,650,000
- Total homes sold: 1,406
-- Share that sold above list: 76.1%

#1. Rochester, New York
- Average price difference: 14.72% over asking
-- Median list price: $224,900
-- Median sale price: $253,375
- Total homes sold: 752
-- Share that sold above list: 77.1%